

When our solar panels and Tesla Powerwall 3 became fully operational in February, I hoped they would reduce expensive daytime electricity use and give us more control over an all-electric home.
They have exceeded my expectations.
That does not mean we have become energy independent, or that every unit of solar has translated into an immediate saving. Our house uses electricity for heating, hot water, cooking and two electric cars. We have also been using air conditioning during the recent hot weather. Our tariff changed during the period, and some of the earliest exported electricity was not yet being paid because the export account was still being sorted out.
This is therefore not a theoretical payback calculation. It is a look at what the system actually produced, where that energy went and what I have learned from living with it.
Our system
The installation consists of:
- 16 Aiko 475W solar panels
- 7.6kW total panel capacity
- eight approximately east-facing panels and eight west-facing panels
- one Tesla Powerwall 3
- a Tesla Gateway providing whole-home backup
The Powerwall started operating in January 2026. The solar system became fully operational on 2 February, with the first recorded generation appearing around 3 February.
The east-west layout matters. It spreads generation across more of the day instead of concentrating everything around a single midday peak. For an occupied, all-electric home, that broader generation window has worked well.
The headline result
Between the start of solar generation in February and the end of June, the panels generated 3,561.7kWh.
Of that:
- 1,013.7kWh was used directly by the home
- 536.3kWh was sent into the Powerwall
- 2,011.7kWh was exported to the grid
In percentage terms, approximately 28.5% went directly into the house, 15.1% went into the battery and 56.5% was exported.
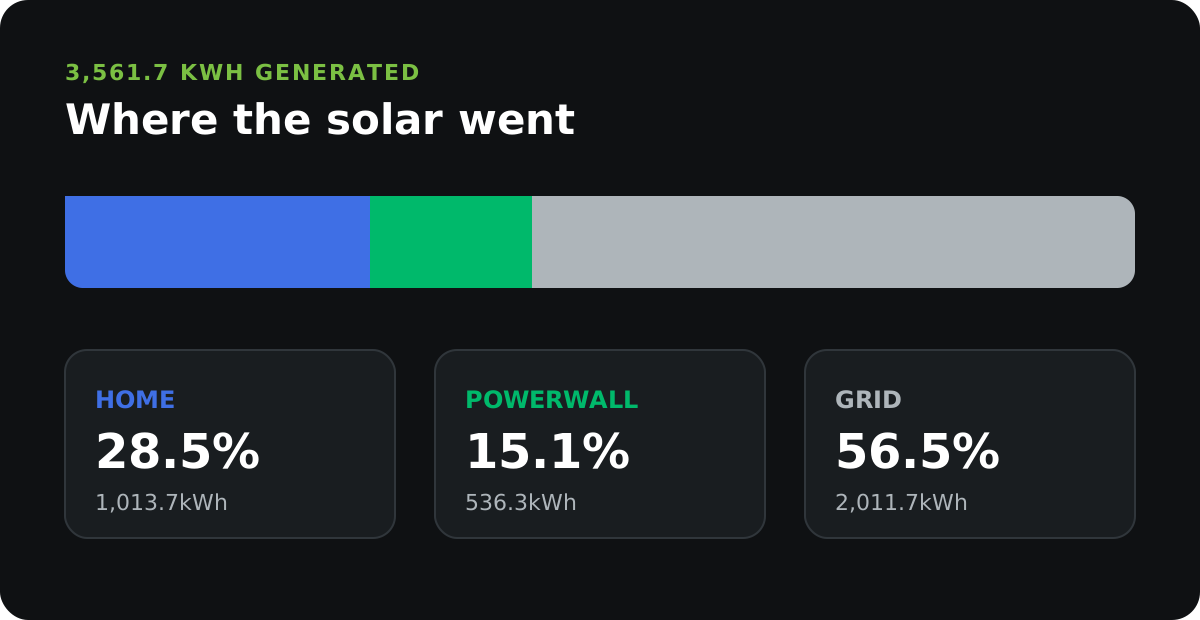
The figures do not mean the battery only delivered 536.3kWh of useful energy. Tesla records that as solar sent into the Powerwall. The battery also charges from the grid when electricity is cheap and then supports the home when import is expensive.
Solar generation by month
| Month | Generated | Used by home | Sent to Powerwall | Exported |
|---|---|---|---|---|
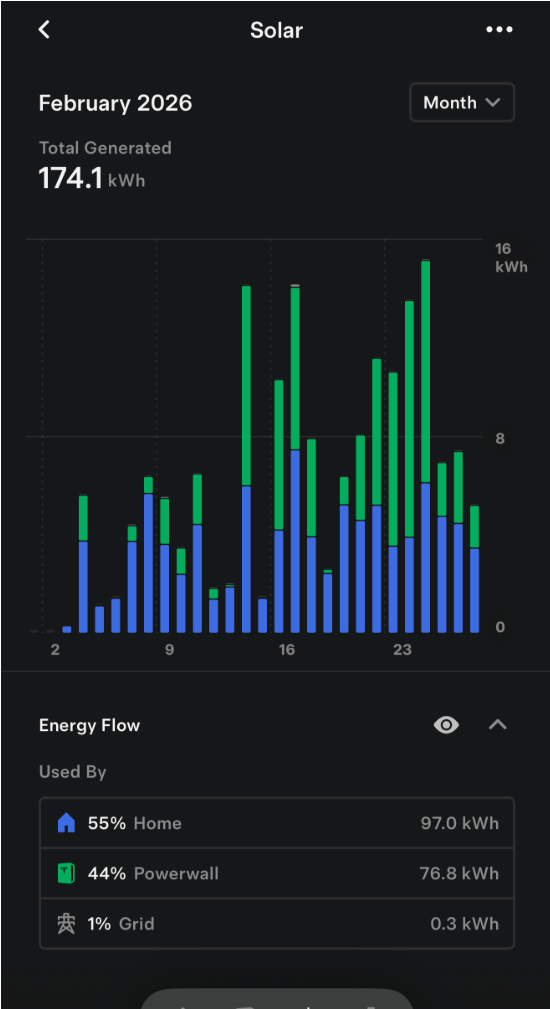
| February* | 174.1kWh | 97.0kWh | 76.8kWh | 0.3kWh |
| March | 505.8kWh | 178.9kWh | 185.0kWh | 141.9kWh |
| April | 905.5kWh | 202.6kWh | 58.6kWh | 644.3kWh |
| May | 997.1kWh | 270.6kWh | 50.2kWh | 676.3kWh |
| June | 979.2kWh | 264.6kWh | 165.7kWh | 548.9kWh |
| Total | 3,561.7kWh | 1,013.7kWh | 536.3kWh | 2,011.7kWh |
*February is a partial month because the solar system became operational on 2 February.
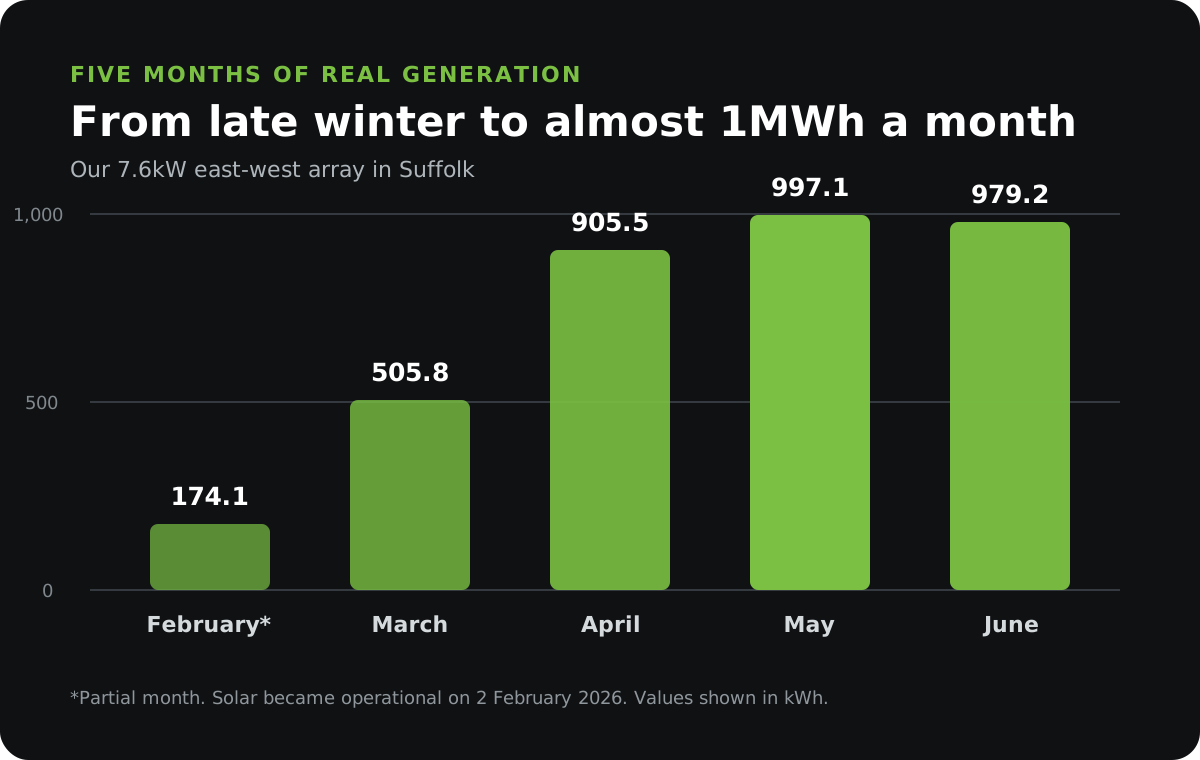
The seasonal change is obvious. Generation rose from 505.8kWh in March to more than 900kWh in each of April, May and June. May was the strongest completed month, producing 997.1kWh.
April and May changed the picture
February and March were useful proof that the system was working. April and May showed what a 7.6kW east-west array could really do as the days became longer.
In April, the panels generated 905.5kWh and exported 644.3kWh. May was even stronger, with 997.1kWh generated and 676.3kWh exported.
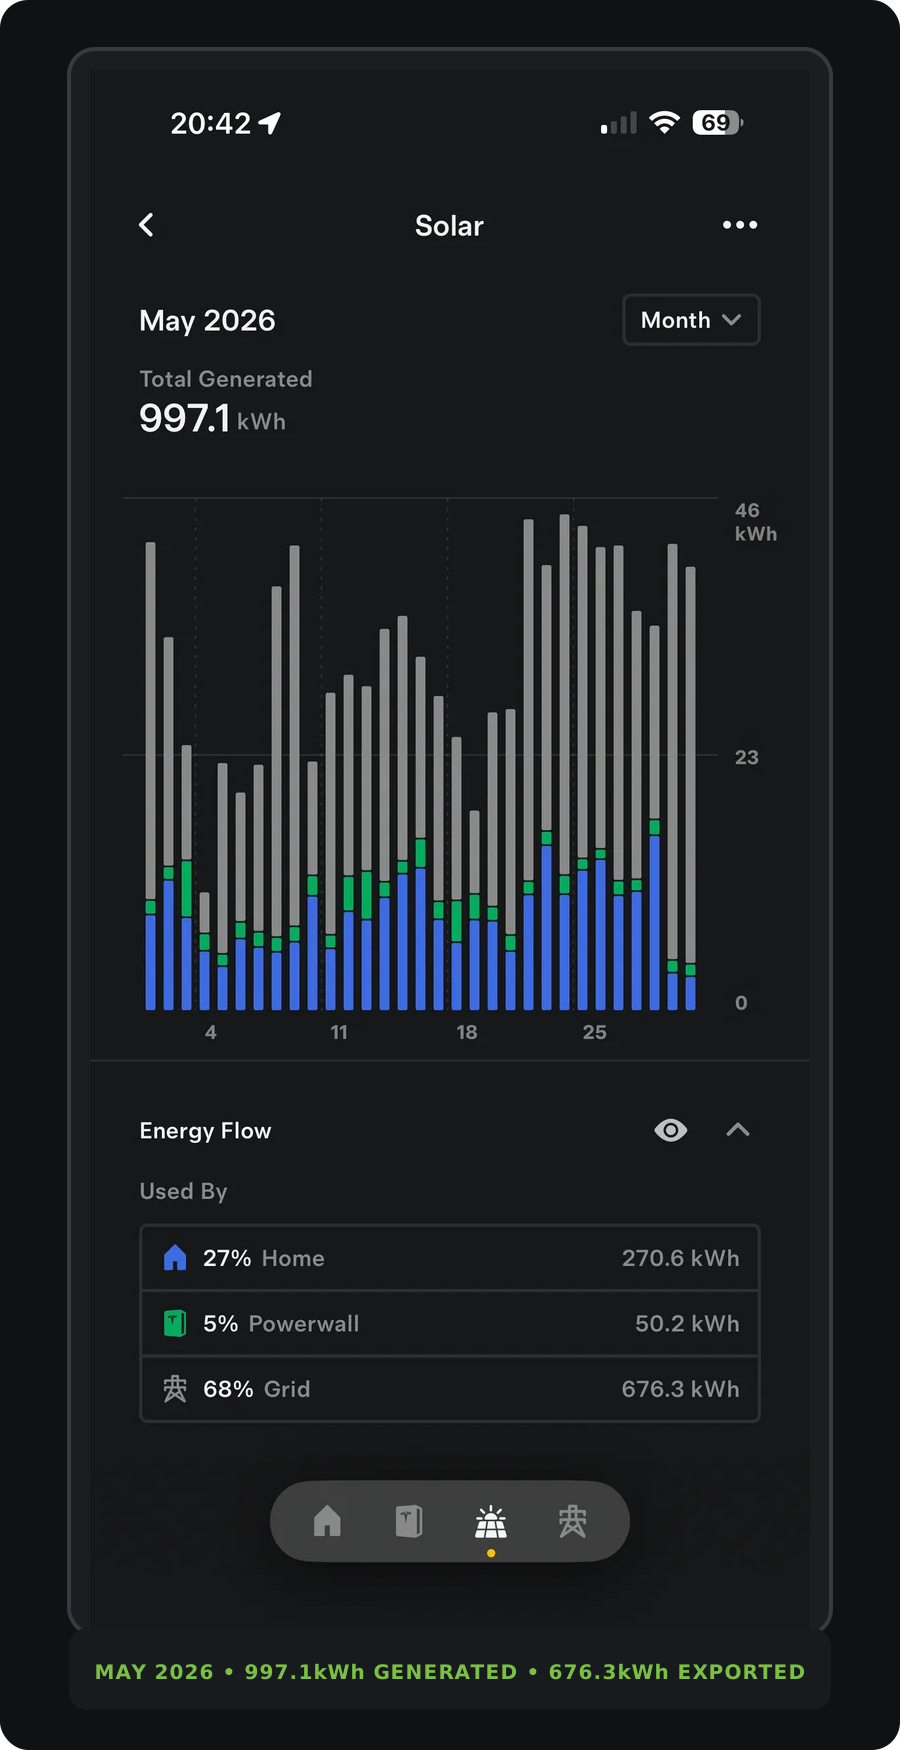
The Powerwall needed relatively little direct solar charging in those months. It often began the day with cheap overnight electricity already stored, while solar comfortably covered the house and produced a large surplus for export.
That was an important lesson. The best financial result is not always achieved by forcing every available unit of solar into the battery. It depends on the relationship between the import price, export price, battery state and likely household demand.
What happened in June
June generated 979.2kWh, only slightly below May. Direct household use increased, and 165.7kWh of solar went into the Powerwall.
The split between home, battery and export changes for several reasons. Weather is one, but so are the battery’s starting charge, EV charging, hot-water demand and the timing of household consumption.
This is why a single headline such as total generation does not tell the whole story. Two months with similar solar output can interact with the house very differently.
The grid figures make that particularly clear. During June, the house imported 684.6kWh and exported 656.3kWh, leaving net grid usage of just 28.3kWh imported.
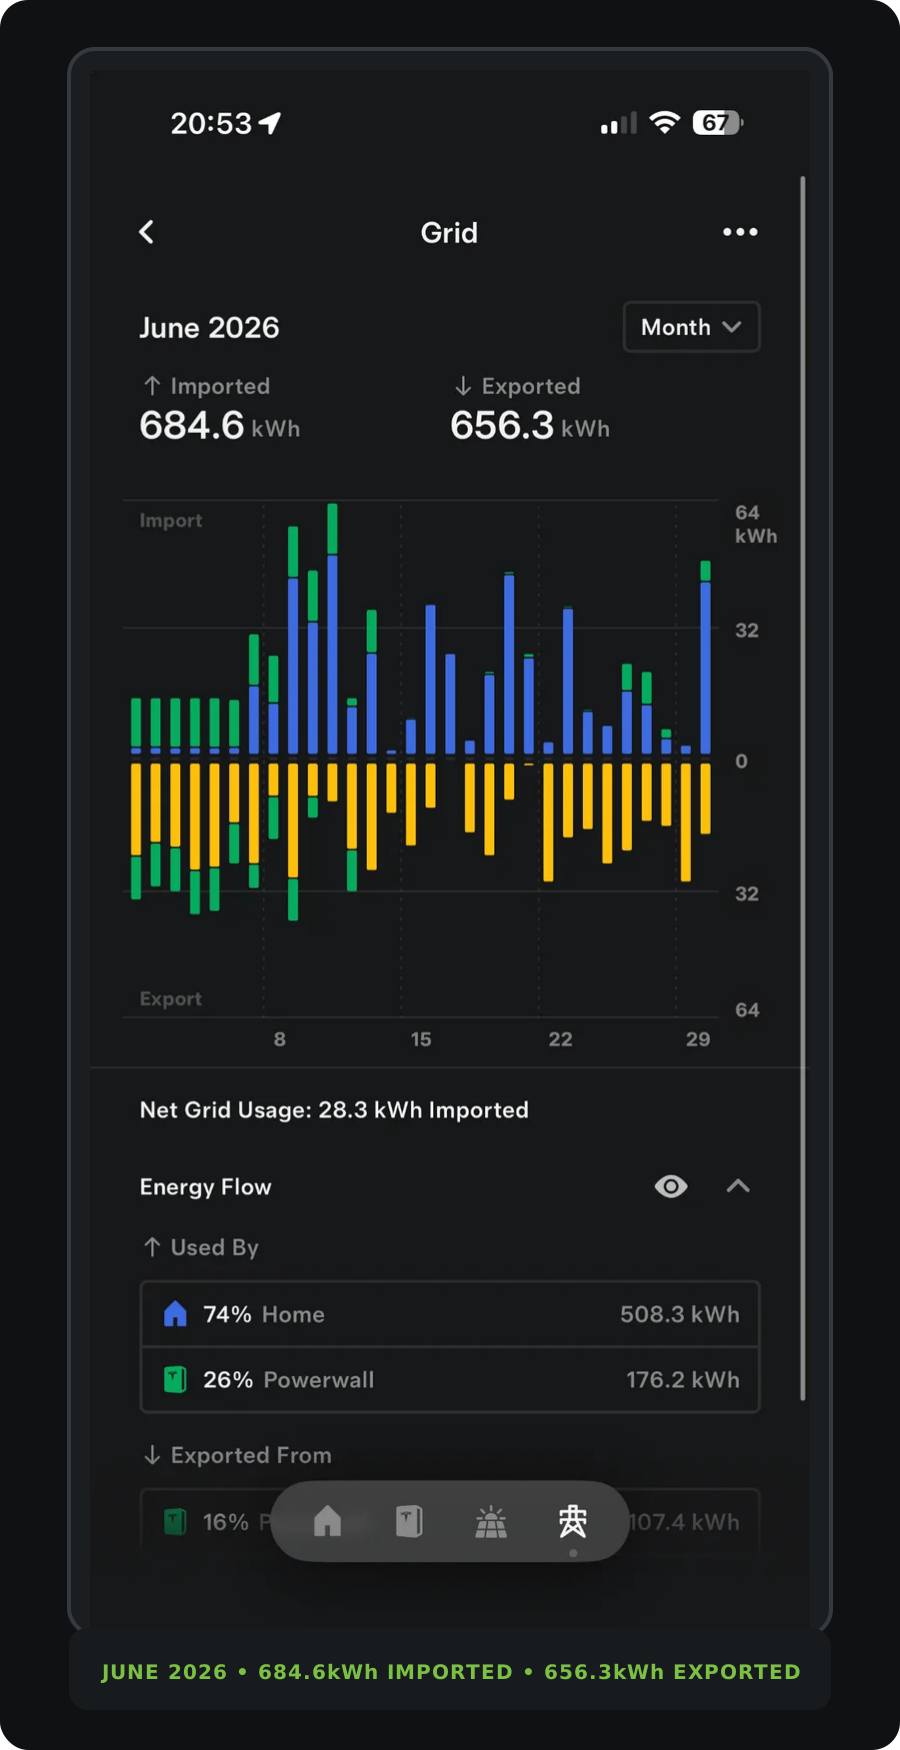
Gross import remained high because it includes electricity deliberately taken from the grid for EV charging and the Powerwall, particularly during cheaper periods. At other times, the house exported solar and some stored energy. Looking only at the import figure would therefore give a misleading impression of how the system was performing.
June is a good example of why I now think about energy in terms of when it is imported or exported, not simply the total volume moving in each direction.
From winter importer to spring exporter
The monthly grid figures show how quickly the balance changed as solar production increased.
| Month | Grid import | Grid export | Net grid position |
|---|---|---|---|
| January* | 302.1kWh | 0.1kWh | 301.9kWh imported |
| February | 666.9kWh | 0.5kWh | 666.4kWh imported |
| March | 405.5kWh | 142.1kWh | 263.4kWh imported |
| April | 533.5kWh | 644.4kWh | 110.8kWh exported |
| May | 675.8kWh | 740.3kWh | 64.5kWh exported |
| June | 684.6kWh | 656.3kWh | 28.3kWh imported |
| July to 10 July* | 225.2kWh | 266.3kWh | 41.1kWh exported |
*January only includes the period after the Powerwall began operating, while July is incomplete. Neither should be compared directly with a full month.
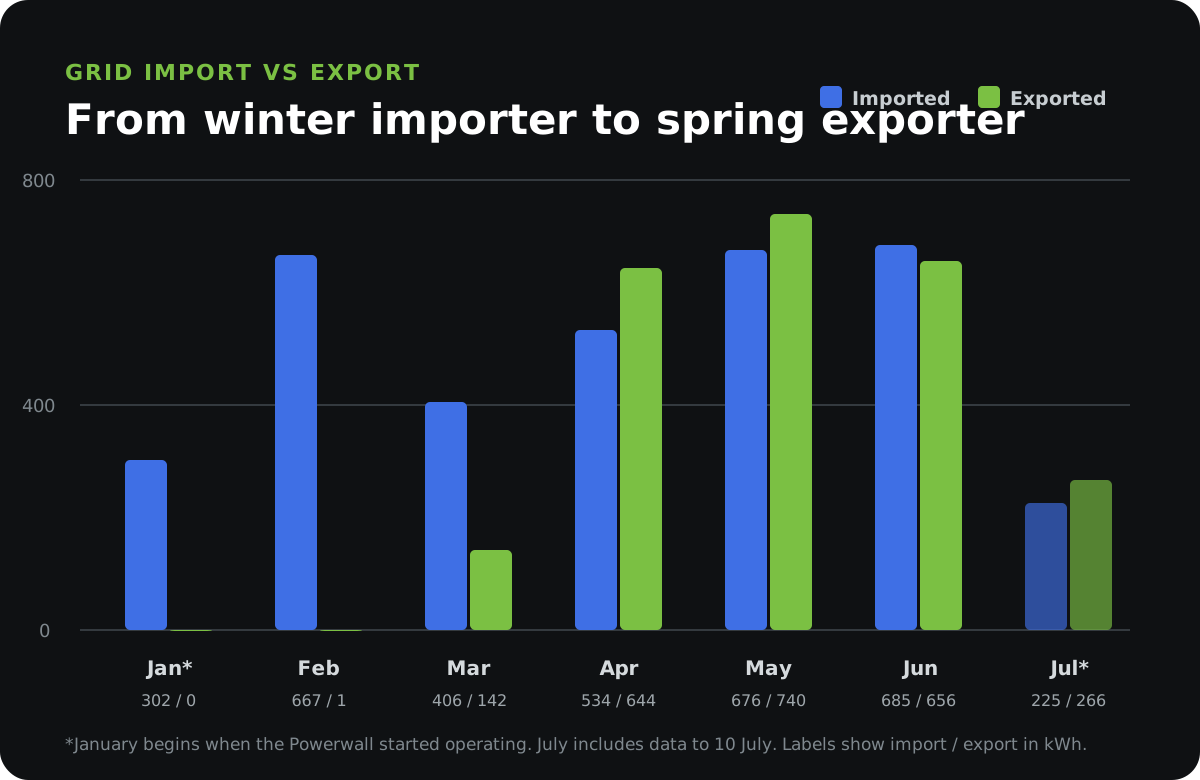
February was still overwhelmingly an import month. Solar had only just come online, winter household demand was high and the system imported 666.9kWh while exporting almost nothing.
By April, the position had reversed. The house exported 110.8kWh more than it imported. It remained a net exporter in May, and July was also in net-export territory at the point these figures were captured.
June sat almost exactly in balance despite substantial energy moving both ways. That is an important distinction. A home can import hundreds of kilowatt-hours for EVs and off-peak battery charging while still exporting a similar amount of solar and stored energy at other times.
From February to June, the five completed solar months, we imported 2,966.3kWh and exported 2,183.6kWh. The remaining net import was 782.7kWh, much of it associated with an all-electric home, two EVs and deliberate off-peak charging rather than uncontrolled peak-rate use.
Has the Powerwall been worthwhile?
For us, yes, although not simply because it stores spare solar.
The Powerwall’s value comes from doing several jobs:
- using cheap off-peak electricity later in the day
- absorbing solar when that is the most useful destination
- reducing or avoiding peak-rate grid import
- supporting the whole house during a power cut
- giving Home Assistant enough data and control to coordinate energy use
The battery has also exposed some awkward interactions. An EV charger is a very large household load, and without intervention the Powerwall can treat car charging like any other demand and discharge into it.
I now use Home Assistant automations to protect the Powerwall during smart EV charging. That work is useful, but it also demonstrates that the Tesla app cannot optimise every combination of battery, EV charger and third-party tariff on its own.
An all-electric home is not a fixed test environment
Our consumption changes constantly.
Winter includes more demand from the air source heat pump. EV charging can add a large load overnight. During the recent extreme heat, air-conditioning increased household use. Hot-water and cooking demand also vary.
That makes comparisons less tidy, but more representative of real life. The system is not being tested in an empty house with a carefully controlled load. It is supporting the way we actually live.
The higher recent home usage is therefore not evidence that solar is underperforming. It shows that more of the electricity being generated is being consumed on site instead of exported.
How the move from Octopus to EDF changes the economics
We recently moved our electricity import and export to EDF.
Our current EDF Export Exclusive rate is 24p/kWh, while the EDF Go Electric off-peak import rate is 6.99p/kWh. Those rates can change and eligibility for the export tariff is restricted, so they should not be treated as a general offer available to everyone.
For our setup, the gap creates a clear strategy:
- import cheaply during the off-peak period when needed
- avoid peak-rate import
- export surplus solar at the higher rate
- use the Powerwall to move energy to the most useful time
At the current 24p rate, exporting 1,000kWh would be worth £240. It would be misleading to apply that rate retrospectively to all 2,011.7kWh exported between February and June. We were not on the EDF export tariff for that whole period, and some early export was unpaid while the export MPAN was being resolved.
The stronger conclusion is that our generation profile suits the new tariff. We now know the system can produce a substantial spring and summer surplus, and the higher export rate gives that surplus more value.
You can read the full reasoning in Why I moved from Octopus to EDF.
What the figures do not prove yet
This is still an early report.
It covers one partial winter month, spring and the beginning of summer. It does not yet show a full autumn or a complete winter with both solar and battery operating together.
It also does not establish a final payback period. A credible payback calculation needs to account for:
- solar used directly in the home
- peak-rate import avoided by the battery
- cheap electricity used to charge the Powerwall
- export income at the rate applying at the time
- battery conversion losses
- standing charges, tariff changes and periods of unpaid export
I would rather publish those calculations once there is enough clean billing data than produce a dramatic but unreliable savings figure now.
What has surprised me most
The amount exported has been the biggest surprise.
I expected an all-electric home with two EVs to consume a much larger share of its solar production. Instead, more than half of the generation recorded from February to June went to the grid.
That reflects strong spring output, overnight EV charging and the Powerwall often beginning the day with cheap electricity already stored. It also explains why the export rate became such an important factor when choosing our next tariff.
The other surprise is how quickly the system became something I rarely needed to think about. I still watch the data and improve the automations, but the underlying equipment simply gets on with the job.
Would I install it again?
Yes.
The installation itself involved more problems than it should have, including a cracked panel, an unconnected array, unexpected extra costs and delays with export paperwork. I covered those issues honestly in our original solar and Powerwall installation article.
The equipment is a different story. The panels have exceeded my early expectations, and the Powerwall has made an all-electric home easier and cheaper to manage.
The system is not magic. It needs the right tariff, sensible settings and, in our case, some Home Assistant automation to deal with EV charging properly. It also represents a substantial investment, with our complete installation costing just under £15,000.
But after roughly six months of living with the Powerwall and five months of solar generation, I am pleased we did it.
The next meaningful update will be after the system has completed a full year. That will allow me to compare every season and use actual import bills and export payments to calculate what the system has really saved and earned.
This article reflects our own home, equipment, tariffs and consumption. Solar performance varies with location, roof orientation, shading, weather and household use. Tariff rates and eligibility can change, so check current terms before making a financial decision.